


Most people who open a trading chart for the first time stare at it like it is written in a language they have never seen. Colors, wicks, lines, candles bouncing up and down. Nobody tells you where to start.
Here is the thing. Once you actually know how to read trading charts, the noise disappears. You stop seeing chaos and start seeing patterns. You start noticing what is about to happen instead of reacting to what already did.
This guide covers everything from what a single candlestick tells you, to how to identify a real trend, to the exact checklist you should run through before placing any trade. No heavy jargon. No theory for the sake of filling space. Just what actually matters when you are sitting in front of a live chart and trying to make a clear decision.
What a Candlestick Tells You in 5 Seconds
Before anything else in learning how to read trading charts, you need to understand the basic unit: the candlestick.
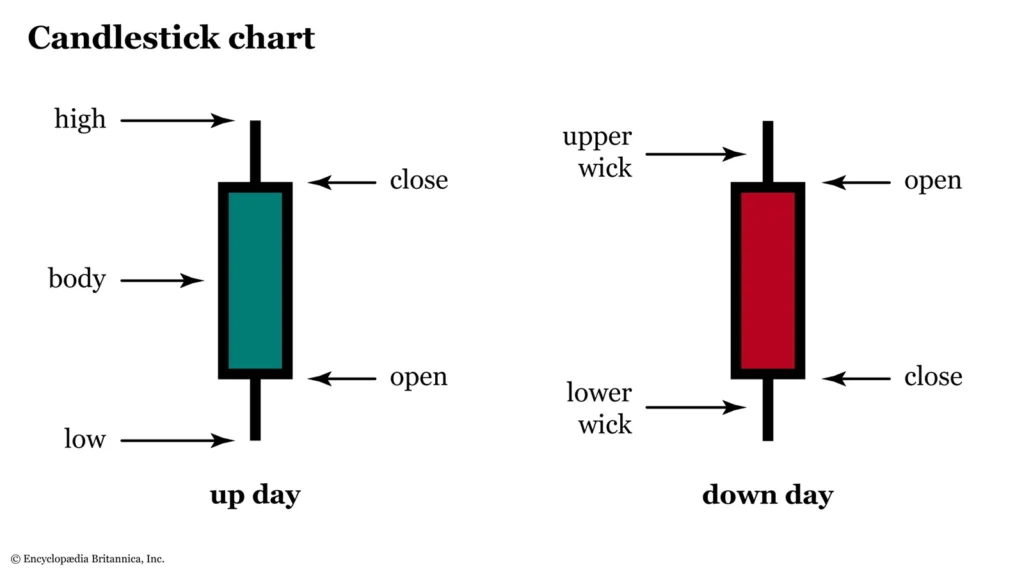
So, what is a candlestick? It shows you four things for any given period of time. The opening price, the closing price, the highest price reached, and the lowest price reached. One candle. Four data points. Everything else builds from there.
The thick part of the candle is called the body. It shows you where price opened and where it closed. The thin lines above and below the body are called wicks or shadows, and they show how far price pushed beyond the open and close before reversing.
If the candle closes higher than it opened, it is bullish. Usually shown in green or white. If it closes lower, it is bearish. Usually shown in red or black. That one detail tells you, at a glance, who was in control for that entire period: buyers or sellers.
A candle with a long body and short wicks shows conviction. One side dominated cleanly. A candle with a tiny body and long wicks stretching in both directions shows confusion, price moving all over without finding any real resolution.
You start reading charts the moment you train your eyes to see that difference in five seconds flat.
Bullish vs. Bearish Candles and What They Actually Mean
The color is obvious. But learning how to read candlestick charts properly means reading past the color.
A bullish candle that opens at the very bottom of its range and closes at the very top, with almost no wicks, is a sign of genuine buying pressure. Buyers stepped in early and stayed in control the entire period. That is completely different from a bullish candle where price opened, dropped sharply, then recovered to close just barely above the open. Both candles are technically green. But they are telling completely different stories about what buyers and sellers were doing.
The same applies to bearish candles. A candle that opens at the top and closes at the very bottom shows sellers were aggressive and consistent throughout. A candle that dips, recovers, then barely closes red is hesitation, not real selling pressure.
Start reading candles like this: not just the color, but the story behind it. Where did price open? Where did it go first? Where did it actually close? What does that sequence say about who was winning that particular battle?
That one habit alone puts you ahead of a large chunk of retail traders who only look at whether the candle is red or green.
The 5 Most Important Candlestick Patterns
Reading individual candles is the foundation. But candlestick patterns, which are specific combinations of one, two, or three candles, are what traders actually act on in live conditions. Getting candlestick patterns explained properly requires seeing each one in context, not just memorizing what they look like.
Here are the five worth knowing first.
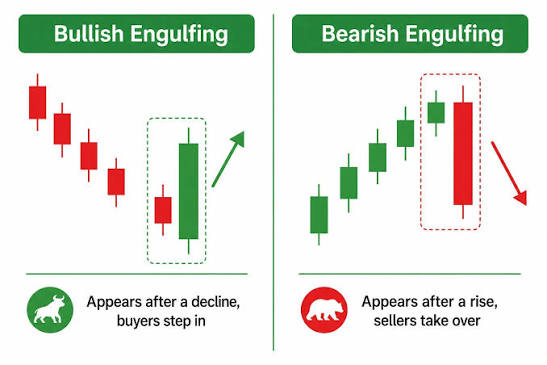
Bullish Engulfing
Two candles. The first is bearish. The second is bullish and its body completely covers the body of the first. It means buyers showed up forcefully enough to erase everything sellers accomplished in the previous period. When this appears at a clear support level, it is one of the cleaner reversal signals you will encounter on any timeframe.
Bearish Engulfing
Same idea, opposite direction. A bullish candle followed immediately by a bearish candle that engulfs it. Sellers taking over at a resistance area. Worth watching especially on the 4-hour and daily chart where the signal carries more weight.
Pin Bar
A candle with a small body and a long wick, usually at one end of the candle. The wick shows you that price moved aggressively in one direction and then got violently rejected, snapping back in the other direction. A bullish pin bar at support tells you sellers tried to break through, failed, and buyers pushed back hard. The longer the wick, the stronger the rejection was.
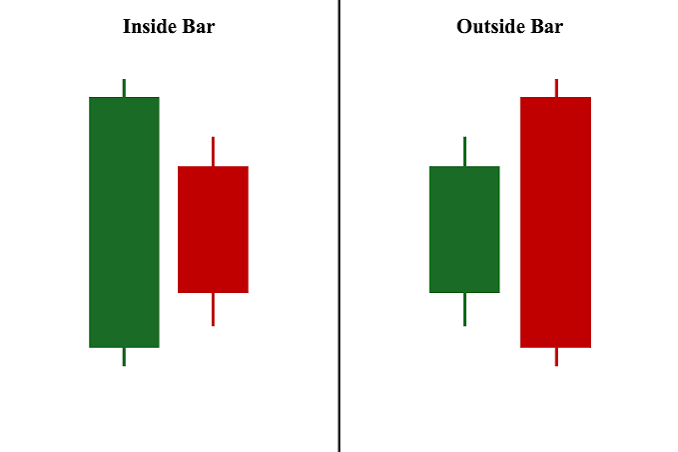
Inside Bar
The entire second candle sits within the range of the first. Nothing broke out either way. Price compressed. Inside bars tend to show up before significant moves because the market is pausing and building pressure. The breakout of the inside bar becomes the trigger.
Doji
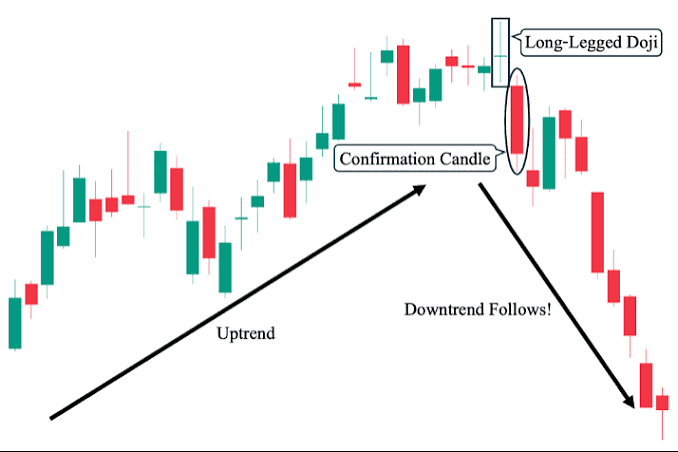
The open and close are at nearly the same level, leaving a very small body with wicks on both sides. Buyers and sellers fought to an exact draw. A doji on its own does not mean much. A doji sitting at a key resistance or support zone after a long trend is a different matter entirely, it is a warning that the trend is running out of energy.
For a deeper look at these patterns with real chart examples, check out the full candlestick patterns guide on the TradingLens AI blog where each setup is paired with practical context on where and when to apply it.
Drawing Support and Resistance Levels Correctly
This is where most beginners go wrong. They either draw too many levels and end up paralyzed by conflicting information, or they draw vague levels in the wrong places and then wonder why price ignores them.
Support is a price area where buyers have historically stepped in and pushed price back up. Resistance is where sellers have historically appeared and pushed price back down. These levels matter because markets have memory. Traders who were trapped on the wrong side of a level remember it. When price returns to that area, they react again.
Here is how to draw them correctly. Look for areas where price made a visible, decisive turning point, not just a brief candle touch, but a clear reaction. The more times price has turned at an area, the more traders are watching it, and the more meaningful it becomes.
Draw the level as a zone rather than an exact line. Price does not always react at the same precise point. Give it some room on both sides, especially when working on higher timeframes.
One thing that trips up a lot of beginners: support becomes resistance once it breaks, and resistance becomes support. When a major level flips, that flip zone is often where the cleanest, most logical trade setups form.
There is a full breakdown of how to identify and draw these levels in the support and resistance guide on this blog, including how to handle levels on different timeframes.
Reading a Trend: Higher Highs and Higher Lows
This part of learning how to read trading charts gets overcomplicated all the time. You do not need an indicator for this. You can see a trend with your own eyes once you know what to look for.
In an uptrend, price makes higher highs and higher lows. Each push upward goes further than the last. Each pullback stops higher than the previous low. That is the structure of an uptrend, and it tells you buyers are in control.
In a downtrend, price makes lower lows and lower highs. Each push downward goes further. Each bounce fails to recover as far as the previous one. Sellers are in control.
When that structure starts breaking down, pay attention. If price has been making higher highs and suddenly fails to break the last high, something is shifting. If it then breaks below the last higher low, the uptrend structure is broken, and the bias changes.
This is what traders call market structure, and it is one of the most consistent things you can track on any chart. It tells you not just where price has been, but whether the current move still has the momentum behind it or is starting to fall apart.
For technical analysis for beginners, here is the most useful habit you can build: always identify the trend on a higher timeframe before you look for entries on a lower one. Trying to buy on a 15-minute chart when the daily chart is clearly in a downtrend is one of the most common, most avoidable mistakes in trading. The higher timeframe always sets the stage.
TradingLens AI identifies this market structure in real time, flagging trend direction and structural breaks across multiple timeframes before most traders looking at the chart manually would spot the shift.
Your Chart-Reading Checklist Before Every Trade
This is where the trading chart basics come together into actual decisions. Knowing how to read trading charts is one thing. Using that knowledge consistently before every trade is what separates traders who improve from ones who stay stuck.
Run through this before you enter anything.
Step 1: Identify the trend on the higher timeframe
Daily or 4-hour first, always. Is price making higher highs and higher lows, or lower lows and lower highs? That is your directional bias. Every trade you consider should align with it, not fight it.
Step 2: Mark the key levels
Where has price turned before in this area? Mark those zones. You want to be entering near a meaningful level, not in empty space in the middle of a range.
Step 3: Wait for a candlestick signal
Do not enter just because price is near a level. Wait for the candle to confirm that buyers or sellers are actually showing up there. An engulfing candle, a pin bar, a strong close above or below the level. That is your trigger, not just the price being close.
Step 4: Confirm with a second timeframe
Drop to your entry timeframe, typically the 1-hour or 15-minute, and see whether the picture aligns with what the higher timeframe showed you. You want the two charts telling the same story, not contradicting each other.
Step 5: Plan your exit before you enter
Where is your stop-loss? Where is your take-profit? What is your risk-to-reward ratio? If you do not know these before you click the button, you are entering blind. Set them both before the trade is open, not while it is running and your emotions are already involved.
Step 6: Check what is on the economic calendar
Are you close to a major news event? High-impact news destroys technical setups with speed that is almost impossible to manage. Forex Factory is the most widely used calendar tool among retail traders, and checking it takes less than 30 seconds.
Running through this list takes about two minutes before each session. It stops you from entering trades on impulse and gives you a structured reason for every decision you make on the chart.
If you want to see exactly how professional traders and AI-generated overlays apply this process on live charts in real time, the ChartLens live sessions from TradingLens AI break down each of these steps as the market is actually moving, across multiple markets and pairs simultaneously.
For more on building a trading mindset that supports consistent chart reading, WhirlSpot Media’s trading psychology coverage is a solid companion resource alongside the technical work.
Learning how to read trading charts is a skill that builds on itself. The first week you practice this seriously, you will still feel uncertain. The second week, you start noticing things you genuinely did not see before. By the third week, the chart starts communicating with you rather than confusing you.
The traders who move past the beginner stage fastest are not the ones who found the most complex system. They are the ones who got genuinely good at reading the basics: what the candlesticks are saying, where the key levels are, and whether the trend structure is intact. Then they stopped adding noise and started filtering for clarity.
That is what charts are really about. Not prediction. Not certainty. Just reading what is actually in front of you and making a decision based on evidence rather than hope.
FREQUENTLY ASKED QUESTIONS
Q: What is the most important candlestick pattern?
The engulfing pattern, both bullish and bearish, is widely considered the most reliable signal available on a bare chart. It shows a clear power shift between buyers and sellers, and when it forms at a key support or resistance level on a higher timeframe like the 4-hour or daily, the signal carries real weight. One well-placed engulfing candle in the right context says more than most combinations of indicators can.
Q: What timeframe should beginners use?
Start with the 4-hour and daily chart. These timeframes show you what the market is actually doing without the noise that makes lower timeframes so difficult to trade consistently. Once you can read the daily chart with confidence and identify trends and key levels without second-guessing yourself, you can drop to the 4-hour for entry refinement. Jumping straight to the 1-minute or 5-minute chart as a beginner is one of the most reliable ways to lose money quickly. The shorter the timeframe, the more random the price movement looks, and the harder it is to find genuine signals.
Q: How do I know if a trend is real?
Look for at least two higher highs and higher lows before calling it an uptrend, or two lower lows and lower highs before calling it a downtrend. One push in a direction is not a trend. Two is a pattern that is worth watching. Three is a trend with enough structure to trade in confidently. The moment that structure breaks, either a higher low gets taken out in an uptrend or a lower high gets broken in a downtrend, the bias changes and you reassess before taking any new positions.
 Tags:

Leave A Comment